รายการของคุณว่างเปล่า
เพิ่มสินค้าเพื่อขอใบเสนอราคา

Key Takeaways:
Enzyme-Linked Immunosorbent Assay (ELISA) tests are a revolutionary testing technique used in quantifying various biological data. This methodology is the gold standard for screening antigens, antibodies, enzymes, and proteins.
ELISA tests work by comparing known concentrations with unknown concentrations to determine the average potency of the target compounds in the unknown concentrates. The technique is remarkably effective, often yielding impressive accuracy scores of 90 - 95%.
ELISA tests are notably critical in screening for infectious viral diseases like HIV and COVID-19. By carefully deploying an ELISA kit, you can reliably detect the viral load in a sample to determine a subject’s exposure level.
Besides viral diseases, ELISA tests have proven effective at assessing vaccine efficacy and monitoring chronic ailments. The technique’s unparalleled accuracy explains its widespread adoption in fields such as biology, biochemistry, pathology, and virology.
According to recent findings, the global ELISA market size stood at USD 2.49 billion in 2024 and is projected to hit USD 3.92 billion by 2030. That represents a compound annual growth rate (CAGR) of 7.84% during the forecast period, underscoring the surging demand for ELISA-based testing.
However, ELISA’s efficiency depends on the approach and methodology. One way to enhance the technique’s accuracy is by using standard curves like the 4PL and 5PL.
Table of Contents:
ELISA’s success depends primarily on the selected kit. While ELISA kits are widely available, prioritize supplies from highly-reputed brands.
Safe and proper kit deployment also determines the accuracy of ELISA tests. After finding a premium ELISA kit, utilize the equipment in strict adherence to the manufacturer’s usage instructions.
Here’s a snippet of how the process unfolds;
Coat a special plate with a known analyte, typically an antigen or antibody.
Add a protein solution to cover the empty sites on the plate. This minimizes non-specific binding, ensuring more quantitative data analysis.
Add more sample to the plate, ensuring the target molecules bind more effectively to the immobilized reagent.
Not all materials will bind to the analyte, which is perfectly alright. Washing eliminates these molecules for a more precise data analysis.
Add a second, enzyme-linked antibody to bind to the sample. Immediately follow up with a suitable substrate to generate color.
Use your preferred ELISA quantification methods to compare the color density of the target analyte against the analyte of known concentration.
Before plotting ELISA curves, it’s prudent to define the format used. Options include;

Normal ELISA tests reveal the general concentration of the target molecule in a sample. They don’t disclose, say, the actual number of plaque-forming units per milliliter (PFU/ml) of blood. That’s where standard curves come in.
ELISA standard curves are graphical tools used to quantify the concentration of unknown analytes in a testing sample, using the concentration of known analytes. These curves are the most reliable way to determine how much of the target compounds are in a sample of unknown concentration.
To make valid inferences, you’ll need to first plot a graph of known analyte concentrations against their optical density (OD) values. You can then check the signal intensity of the unknown analyte to determine the potency of the screened substances.
One principal feature of the ELISA kit standard curve is its sigmoidal or S shape, with the 4PL and 5PL being the most common regression models.
4PL stands for 4-parameter logistic, while 5PL represents 5-parameter logistic. Both are mathematical, non-linear regression models designed to let you generate ELISA standard curves for accurate quantification of analyte concentrations. They’re incredibly effective at conducting a proper ELISA kit data analysis.
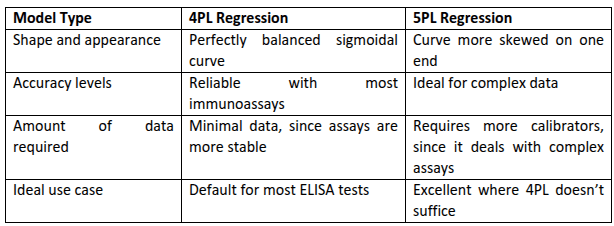
Although 4PL and 5PL are generally S-shaped, they vary in actual appearance, overall complexity, and ideal use cases.
4PL typically renders as a symmetrical S. It’s the default regression model used for standard ELISA analyses.
5PL is an asymmetrical S, where one curve appears distinctively steeper than the other. This extra parameter enables technicians to accurately analyze more skewed assays.
Here’s a quick comparison between 4PL and 5PL ELISA standard curves.
Both 4PL and 5PL regression models include four critical data analysis points, namely;
Minimum and maximum signals are the horizontal asymptotes, while the inflection point denotes the areas where a curve changes its bend.
Slope refers to the curve’s steepness.
Slope and inflection points are the most critical aspects determining whether an ELISA calibration curve winds up as a 4PL or 5PL. Gentler features render a near-perfect symmetrical shape (4PL), while kinks produce a skewed design (5PL).

4PL and 5PL can appear similar to an untrained eye. However, you must define which curve you’re working with to conduct an accurate ELISA test.
Note that 4PL works best for symmetrical curves with four calibrator points. 5PL is ideal where the curve produces a distinct pattern shift, adding a fifth parameter to the equation.
Since 5PL regressions analyze more complex data points, choosing proper software can minimize ELISA assay variability. If all these sound more theoretical and less practical, conducting a normal ELISA test for the target analyte can help you master the concepts better.
Here’s how to go about it;
Typically, analytes of known concentrations go on the X-axis, while their unknown OD values go on the Y-axis.
Utilize the correct curve fitting formula, which varies by specific regression. The thumb rule is to start with ELISA 4PL curve fitting.
You can use the Log/Log or Log/Semi-Log formula to linearize your ELISA data.
Note that ELISA 5PL curve fitting is relatively easy to identify once you've started working with the 4PL. A visible kink on the pattern suggests more nuanced data in the tested samples.
An accuracy score within 10% validates the data's accuracy.
For enhanced data reliability, determine whether both the known and unknown concentrations were diluted. If yes, multiply the findings by the dilution factor.
And, for better ELISA kit protocol optimization, ensure the data covers the expected range of the tested samples. If you’re testing higher samples, adjust the standard range accordingly.
You also want to mark anchor points at both extremes of the S-curve to pinpoint the asymptotes in 5PL models. Be sure to also remove outliers, i.e., standards that plot unreasonably outside the curve.
Weighting is critical for standard curve fitting, particularly at the curve’s lower ends, where variability is typically higher. Apply the 1/y or 1/y2 weighting formula to enhance the accuracy of standard curves at lower concentrations.
Ideally, higher weights should correspond with lower absorbance values. This reduces error rates in your curve-fitting software, ensuring a more precise measurement of the concentrations of unknown samples.
If properly applied, weighting can streamline ELISA kit standard curve analysis remarkably. It minimizes variances by hundreds of percentages, making weighted curves more reliable.
However, weighting isn’t always necessary. The technique is notably needless for assays with smaller, narrower OD ranges of 0.2 - 0.5.
Software can make or break your ELISA standard curve analysis. While options abound, you want to proceed cautiously while selecting the right ELISA curve fitting software.
Excel-based solutions are preferable for their accessibility and user-friendliness.
However, standard Excel is best for basic linearized data. For complex data visualization, consider the following specialized add-ins;
Other reputable ELISA data analysis tools besides Excel-based ELISA curve fitting models include;

Mastering ELISA standard curves is the key to unlocking the technique’s accuracy.
Standard curves are the basis for converting optical density data into more accurate, quantitative readings. The technique relies on sigmoidal curves, with 4PL and 5PL being the preferred mathematical models.
While both 4PL and 5PL models assume an S-shaped curve, they differ principally in the distinct appearance of their shoulders. And that seemingly trivial detail can tilt the balance between accurate and unreliable ELISA data.
Selecting between 4PL and 5PL depends primarily on the screening type. 4PL assumes a more symmetrical S-curve and is perfect for analyzing common and stable assays.
5PL incorporates an additional parameter, rendering one side of the S-curve distinctively steeper or flatter than the other. That nuanced detail makes 4PL ideal for analyzing unstable ELISA assays that result in a rather skewed S-curve.
Note that choosing the right ELISA standard curve doesn’t consist only in deciding between 4PL and 5PL mathematical models. For more reliable screening, it’s best to start with the right ELISA kits.
Source your ELISA kit from a reliable supplier with a proven track record. More importantly, follow the manufacturer’s guidelines to enhance each test’s accuracy and reliability.
ELISA standard curves are graphical representations used to quantify the amount of analytes in an unknown concentration by comparing it with a known concentration.
While ELISA standard curves mostly target antigens and antibodies, they may also help detect viral and bacterial loads in samples.
There are several ELISA formats to pick from, including Direct ELISA, Indirect ELISA, Sandwich ELISA, and Competitive ELISA.
4PL regressions are symmetric sigmoidal curves used for standard ELISA tests, while 5PL regressions are ideal for analyzing skewed immunoassays.
Consider the 5PL regression when an ELISA standard curve produces distinct kinks.
